L’Oréal in figures
The Group achieved its best year of sales growth in more than 10 years in 2018. Operating margin set a new record, confirming the ability of L’Oréal’s business model to deliver robust performance and create significant value.
- Our performance
- Our profit
- "SHARING BEAUTY WITH ALL"
1st
cosmetics Group worldwide
countries
patents registered in 2018
brands
86,000
employees
Our performance
L’Oréal’s balanced business model enables the construction of long-term profitable growth.
sales in 2018
+7.1%
like-for-like sales growth
Breakdown of 2018 sales
(as %)
DIVISIONS
-
Consumer Products Division
44.7% -
L'Oréal Luxe
34.8% -
Professional Products
12.1% -
Active Cosmetics
8.4%
GEOGRAPHIC ZONES
-
Western Europe
29.9% -
Northern America
26.9% -
New markets: 43.2%
-
Asia Pacific
27.5% -
Latin America
6.6% -
Eastern Europe
6.5% -
Africa, Middle-East
2.6%
-
BUSINESS SEGMENTS
-
Skincare (incl. sun protection)
31.8% -
Makeup
27.4% -
Haircare
16.2% -
Hair colouring
10.9% -
Fragrances
9.3% -
Other
4.4%
Weight of digital in sales
of sales in e-commerce
of consolidated sales in e-commerce
like-for-like growth in e-commerce sales in 2018
Consolidated sales
(in million €)
2018 like-for-like growth
Our profit
€4.92 Bn
operating profit
+8.5%
increase in dividend per share
Record operating margin at 18.3% of sales
(in million €)
Operating profit
+5.3%
Growth in operating profit
Operating margin
(in %)
Net profit excluding non-recurring items after non-controlling interests
(in million €)
+6.4%
Growth in net profit excluding non-recurring items after non-controlling interests
Earnings per share
(in €)
-
3.42
-
4.01
-
4.32
-
4.73
-
4.99
-
5.34
-
6.18
-
6.46
-
6.65
-
7.08
+6.5% earnings per share in 2018
Balanced operating profitability
21.1%
Total operational Divisions' profitability
Profitability by Division
(as % of Division sales)
Profitability by geographic Zone
(as % of Zone sales)
A solid financial situation at 31 December 2018
Net cash surplus
2,751
million euros
Short-term ratings
-
A1+
Standard & Poor's
-
Prime 1
Moody's
-
F1+
Fitch Ratings
Capital expenditure
of sales
A dynamic shareholder return policy
increase of dividend in 2018
€4.23
preferential dividend of +10% for shareholders holding registered shares
- Dividend per share
- Preferential dividend
Pay-out ratio
(as % of profit)
pay-out ratio as % of profit
-
€201.2
share price at 31 December 2018
-
€112.7 Bn
market capitalisation at 31 December 2018
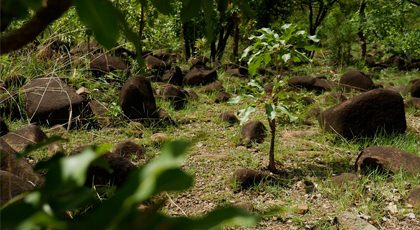
Our "Sharing Beauty With All" indicators
The aim of the sustainable transformation programme “Sharing Beauty With All”, launched in 2013, is to make L’Oréal a model company in terms of sustainable innovation, production, consumption, and in sharing its growth with all Group stakeholders.

79% of new products in 2018 have an improved environmental or social profile
-77%
reduction in CO2 emissions in absolute value in plants and distribution centres since 2005

-48%
reduction in water consumption since 2005
-37%
reduction in waste generation since 2005
3 A
ratings from CDP for reducing carbon emissions, managing water sustainably and protecting forests in the supply chain
88%
of brands have assessed their environmental or social impact
63,584
people from socially or economically disadvantaged communities gained access to employment
83%
of the Group’s strategic suppliers have been assessed and selected on the basis of their environmental and social performance
96%
of the Group’s permanent employees have health insurance in line with best practices in their country of residence