L’ORÉAL’S 2014 FINANCIAL PERFORMANCES
COSMETICS GROUP
WORLDWIDE(1)
BILLION EUROS
OF SALES IN 2014
COMPLEMENTARY
BRANDS
Countries
EMPLOYEES
PATENTS REGISTERED
IN 2014
(1) Source : “Beauty’s Top 100” WWD, August 2014.
SALES GROWTH
IN ALL DIVISIONS
AND ZONES
In 2014, L’Oréal’s sales amounted to 22.53 billion euros, an increase of +3.7%(1). In a volatile economic context and a less dynamic cosmetics market, the group posted growth in all its Divisions and in all geographic zones. The New Markets, the number 1 zone for the group since 2012, accounted for 39.6% of sales.
(1) Like-for-like.
The announcement on February 11th, 2014, of the disposal of 50% of Galderma leads to account for this business in accordance with IFRS 5 accounting rule on discontinued operations. In accordance with IFRS 11 accounting rule, Innéov has been consolidated under the equity method of January 1st, 2014. All figures for earlier periods have been restated accordingly.
BREAKDOWN OF 2014 SALES
(Cosmetics Divisions, as %)
(1) “Other” includes hygiene products and sales made by American distributors with brands outside of the group.
RECORD OPERATING MARGIN
AND STRONG INCREASE
IN NET PROFIT
The announcement on February 11th, 2014, of the disposal of 50% of Galderma leads to account for this business in accordance with IFRS 5 accounting rule on discontinued operations. In accordance with IFRS 11 accounting rule, Innéov has been consolidated under the equity method of January 1st, 2014. All figures for earlier periods have been restated accordingly.
(1) Net profit excluding non-recurring items after non-controlling interests does not include impairment of assets, restructuring costs, tax effects or non-controlling interests. (2) Diluted net earnings per share excluding non-recurring items after non-controlling interests.
A SOLID BALANCE SHEET
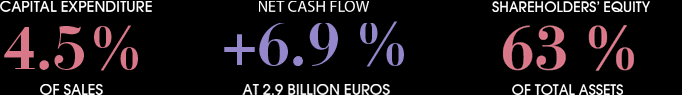
With shareholders’ equity amounting to 20 billion euros, L’Oréal’s balance sheet remains particularly solid, after the purchase of 8% of the capital from Nestlé for 6 billion euros.
A DYNAMIC
SHAREHOLDER RETURN POLICY
(at December 31st, 2014)
SHARE PRICE
MARKET CAPITALISATION (5)


The quality of the balance sheet, financial performance and prospects of L’Oréal led the Board of Directors to propose at the Annual General Meeting of shareholders a dividend of 2.70 euros(2), an increase of +8%. The pay-out ratio in 2014 amounted to 50.6%(3).
Moreover, L’Oréal shareholders receive a loyalty bonus for holding their shares in registered form: a preferential dividend of +10%(1), making a total of 2.97 euros.
(1) For shareholders who continuously hold their shares in registered form for a minimum of two full calendar years, up to a maximum of 0.5% of the capital for the same shareholder. (2) Dividend proposed at the Annual General Meeting on April 22nd, 2015. (3) Based on the dividend proposed at the Annual General Meeting on April 22nd, 2015. (4) Pay-out ratio based on diluted net profit excluding non-recurring items, after non-controlling interests, per share. (5) On the number of shares at December 31st, 2014, i.e. 561,230,389.