
Financial performance
2023 was another spectacular year: L’Oréal once again outperformed a dynamic global beauty market and strengthened its position as the world’s No.1 beauty company, thanks to the power of its multipolar model, the desirability of its brands, and the creativity and commitment of its teams around the world. Achieving its best growth in 20 years (excluding the post-Covid rebound in 2021), the Group broke the €40-billion sales barrier for the first time and posted record results.
Sales
-
€41.18 Bn sales in 2023
-
+11.0% like-for-like growth
-
+7.6% reported growth
Breakdown of 2023 sales

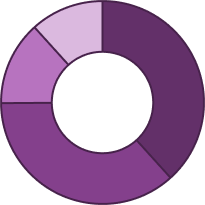


Divisions
| 36.8% | Consumer Products |
|---|---|
| 36.2% | Luxe |
| 15.6% | Dermatological Beauty |
| 11.3% | Professional Products |
Regions
| 31.6% | Europe |
|---|---|
| 27.1% | North America |
| 25.9% | North Asia |
| 8.4% | SAPMENA – SSA |
| 7.1% | Latin America |
Categories
| 39.9% | Skincare and sun protection |
|---|---|
| 19.7% | Makeup |
| 15.3% | Haircare |
| 12.6% | Fragrances |
| 8.3% | Hair colouring |
| 4.1% | Other |
E-commerce continued to grow
-
€11.2 Bn sales in e-commerce
-
27% of consolidated sales
-
+9.5% growth in e-commerce sales
Consolidated sales grew by 11%
(in billions of euros)
| Year | Value |
|---|---|
| 2014 | 22.53 |
| 2015 | 25.26 |
| 2016 | 25.84 |
| 2017 | 26.02 |
| 2018 | 26.94 |
| 2019 | 29.87 |
| 2020 | 27.99 |
| 2021 | 32.28 |
| 2022 | 38.26 |
| 2023 | 41.18 |
2023 Profits
Increase in operating profit: +9.2%
(in millions of euros)
| Year | Value |
|---|---|
| 2014 | 3,891 |
| 2015 | 4,388 |
| 2016 | 4,540 |
| 2017 | 4,676 |
| 2018 | 4,922 |
| 2019 | 5,547 |
| 2020 | 5,209 |
| 2021 | 6,160 |
| 2022 | 7,456 |
| 2023 | 8,143 |
Further improvement in operating margin
to 19.8% of sales
(in %)


| Year | Value |
|---|---|
| 2019 | 18.6 |
| 2020 | 18.6 |
| 2021 | 19.1 |
| 2022 | 19.5 |
| 2023 | 19.8 |
Net profit grew by +7.1%, excluding non-recurring items after non-controlling interests
(in millions of euros)
| Year | Value |
|---|---|
| 2014 | 3,125 |
| 2015 | 3,490 |
| 2016 | 3,647 |
| 2017 | 3,749 |
| 2018 | 3,988 |
| 2019 | 4,356 |
| 2020 | 4,099 |
| 2021 | 4,938 |
| 2022 | 6,054 |
| 2023 | 6,486 |
Earnings per share increased by +7.3%
(in euros)
| Year | Value |
|---|---|
| 2014 | 5.34 |
| 2015 | 6.18 |
| 2016 | 6.46 |
| 2017 | 6.65 |
| 2018 | 7.08 |
| 2019 | 7.74 |
| 2020 | 7.30 |
| 2021 | 8.82 |
| 2022 | 11.26 |
| 2023 | 12.08 |
Operating profitability above 20% in our 4 Divisions
(as a % of Division sales)
| Divisions | Value |
|---|---|
| Professional Products | 21.6% |
| Consumer Products | 20.5% |
| Luxe | 22.3% |
| Dermatological Beauty | 26.0% |
A solid financial situation at 31 December 2023
-
AA Standard & Poor’s (September 2023)
Long-term ratings -
A1+ Standard & Poor’s (September 2023)
Short-term ratings -
Aa1 Moody’s (March 2022)
Long-term ratings -
Prime-1 Moody’s (March 2022)
Short-term ratings
Bonds
-
€3 billion In 2022, L’Oréal’s inaugural public bond offering including a sustainability linked tranche
-
€2 billion In May 2023, L’Oréal successfully completed a bond issue under the EMTN programme used for general corporate purposes including the acquisition of Aesop.
-
€1.5 billion In November 2023, L’Oréal issued a new bond under the EMTN programme to refinance bond maturities in 2024.
Capital expenditure
3.6% of sales
A dynamic shareholder return policy
Continued dividend growth: +10%
| Year | Dividend | Preferential dividend +10% |
|---|---|---|
| 2023 | 6.60 | 7.26 |
| 2022 | 6.00 | 6.60 |
| 2021 | 4.80 | 5.28 |
| 2020 | 4.00 | 4.40 |
| 2019 | 3.85 | 4.23 |
| 2018 | 3.85 | 4.23 |
| 2017 | 3.55 | 3.90 |
| 2016 | 3.30 | 3.63 |
| 2015 | 3.10 | 3.41 |
| 2014 | 2.70 | 2.97 |
Pay-out ratio: 54.6% of profits
(as % of profit)


| Year | Value |
|---|---|
| 2014 | 50.6 % |
| 2015 | 50.2 % |
| 2016 | 51.1 % |
| 2017 | 53.4 % |
| 2018 | 54.4 % |
| 2019 | 49.7 % |
| 2020 | 54.8 % |
| 2021 | 54.4 % |
| 2022 | 53.3 % |
| 2023 | 54.6 % |
-
€450.65 share price at 31 December 2023
-
€241 Bn market capitalisation
Over 5 years, the L’Oréal share has outperformed the CAC 40
L’Oréal vs CAC 40 from 31 December 2018 to 31 December 2023


| Month/Year |
CAC 40 in points |
L'Oréal share price in € |
|---|---|---|
| 12/2018 | 196.55 | 201.20 |
| 28/06/2019 | 230.13 | 250.50 |
| 31/12/2019 | 248.37 | 264.00 |
| 30/06/2020 | 205.08 | 285.70 |
| 31/12/2020 | 230.65 | 310.80 |
| 30/06/2021 | 270.38 | 375.80 |
| 31/12/2021 | 297.19 | 416.95 |
| 30/06/2022 | 246.08 | 329.30 |
| 30/12/2022 | 268.97 | 333.60 |
| 30/06/2023 | 307.45 | 427.10 |
| 29/12/2023 | 313.40 +59.4% | 450.65 +123.9% |
Total shareholder return
Amongst the various economic and financial measures of value creation, L’Oréal prefers Total Shareholder Return (TSR). This indicator is based on a range of criteria, including the share price and revenue received in the form of dividends excluding taxes on capital gains and dividends.
10 year return
Total Shareholder Return for around €15,000 invested in L’Oréal shares, including reinvestment of dividends, excluding bank charges and tax.

| Year | Capital invested € | Number of shares |
|---|---|---|
| 2013 | 15,068 | 118 shares |
|
2023 Value at 31/12/2023 |
64,443 (x4) (+15.3% growth per year) |
143 shares |
Total annual return
Based on the share price of 31 December 2023
-
+19.0% over 5 years
-
+15.3% over 10 years
-
+12.1% over 20 years

